As Bitcoin (BTC) Remains Stuck Below $29,000, These 9 Indicators Suggest the Bull Market Remains Alive and Well


Bitcoin (BTC) remains stuck to the south of the $29,000 level amid a lack of fresh positive catalyst to sustain the bullish momentum that saw it hit fresh yearly highs around $31,800 earlier this month.
The cryptocurrency is for now holding to the north of its 50-Day Moving Average at $29,100 as Wednesday’s US Federal Reserve policy announcement looms.
Markets are expecting a final 25 bps rate hike from the central bank, taking interest rates to 5.25-5.50%, their highest level in 22 years.
While this expected rate hike is unlikely to impact bitcoin, the bank’s tone on the outlook for fresh interest rate hikes could trigger some volatility.
The Fed has signaled they could hike rates again later in the year given the still strong labor market, though recent improvements relating to the US inflation rate has eased pressure on the bank to keep hiking.
The fact that the end of the Fed’s tightening cycle is near has been widely touted as a key reason why the bitcoin price outlook is looking up from here – traders will recall that the Fed’s aggressive tightening last year to combat surging inflation was a key reason why the bitcoin price got hammered so badly.
Other factors such as increased institutional interest in bitcoin, as represented by the wave of recent spot bitcoin ETF applications from Wall Street heavyweights like BlackRock, and XRP issuer Ripple’s recent partial legal victory over the US Securities and Exchange Commission (SEC) are arguably also major tailwinds for the bitcoin outlook.
But it isn’t just fundamental factors that suggest things are looking up for bitcoin.
Here are ten widely followed technical and on-chain indicators that suggest the bull market that began in 2023 remains alive and well.
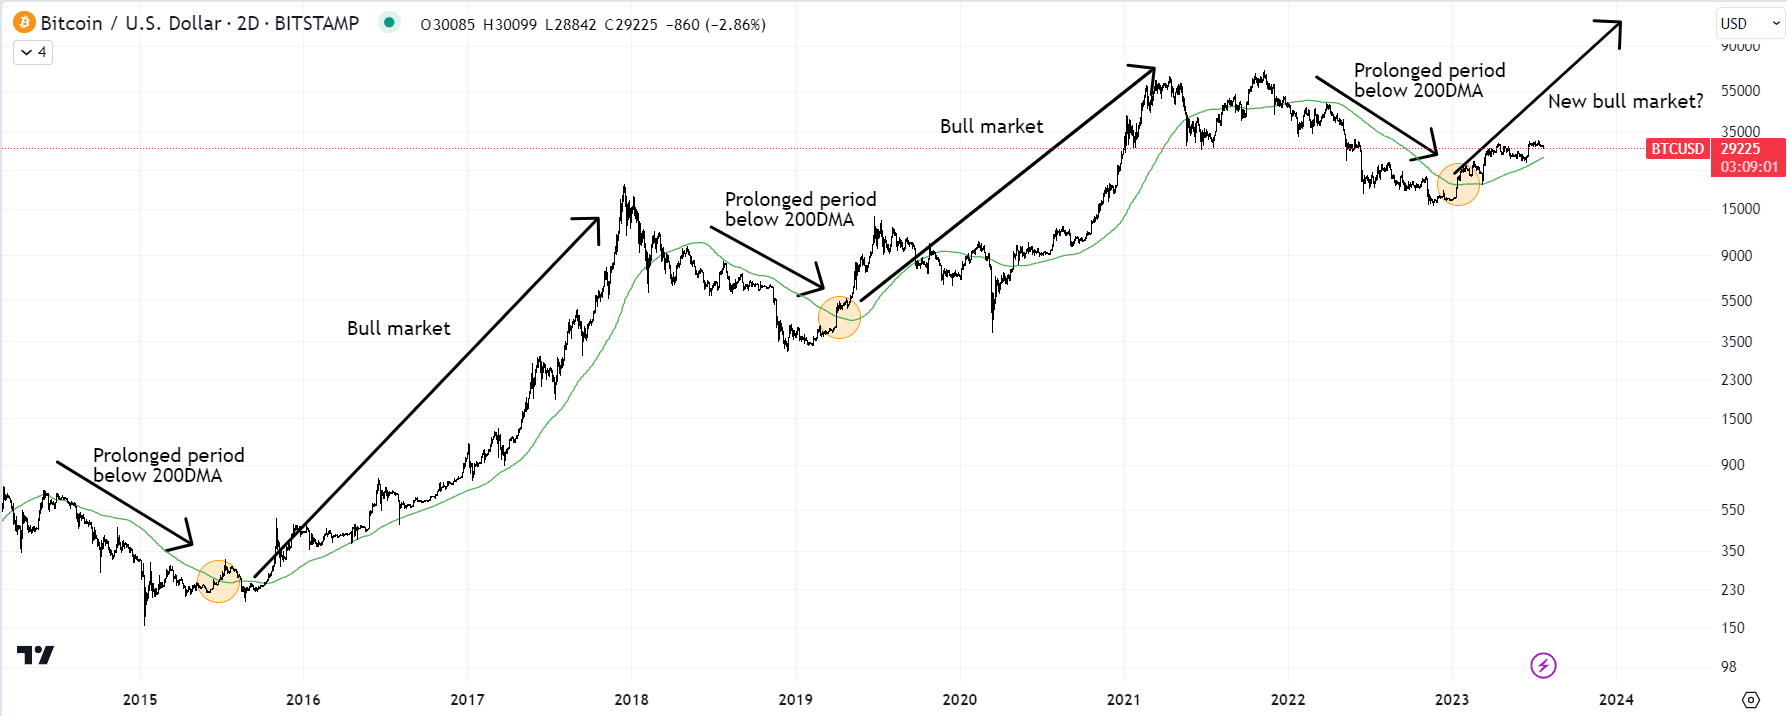
Bitcoin is Back Above its 200DMA, Which Continues to Act as Strong Support
When bitcoin breaks back above its 200-Day Moving Average following a prolonged spell below it, as was the case back in January, this has historically occurred in the early stages of a new bull market cycle, and has historically been a very good long-term buy signal.
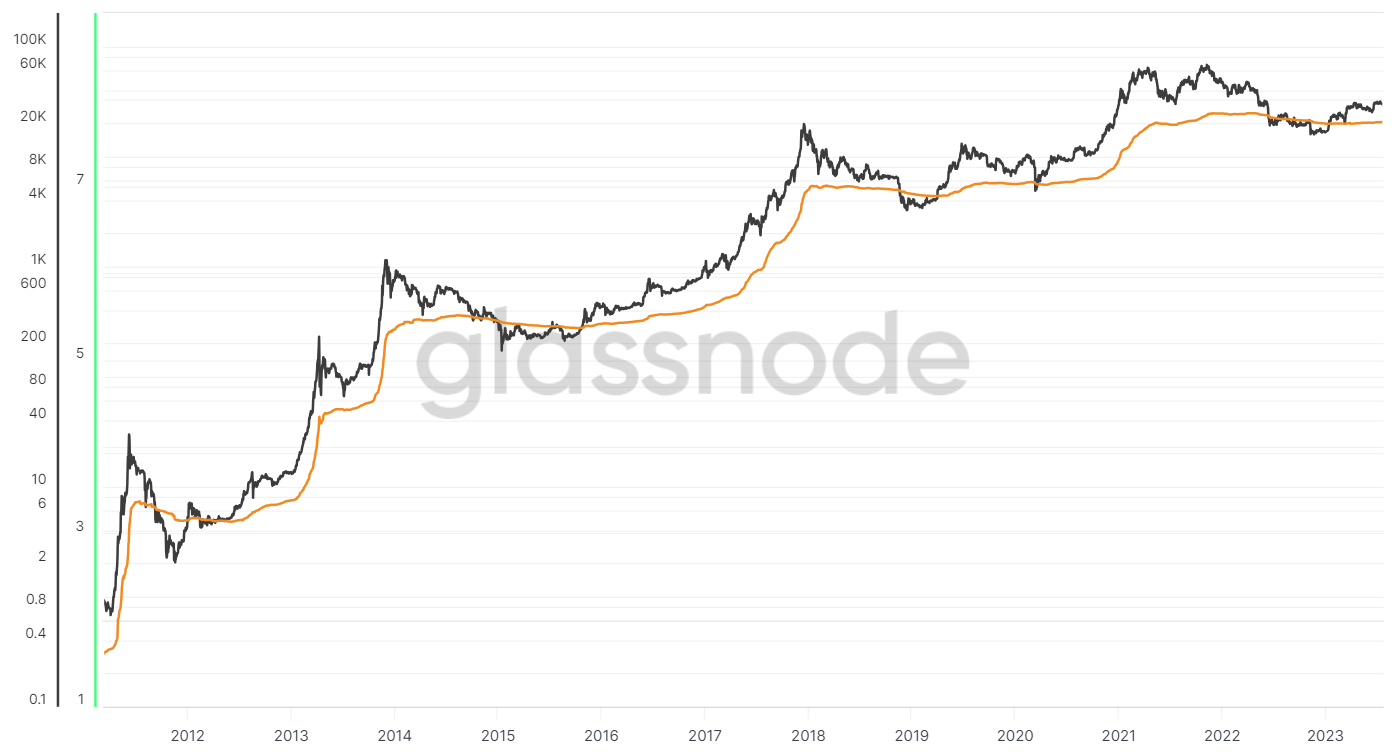
Bitcoin is Back Above its Realized Price
Around the same time when bitcoin broke back above its 200DMA, it also broke back above its Realized Price, which is the mean BTC price at the time when each BTC coin last moved (a proxy for the average price investors paid for their bitcoin).
The below chart from crypto analytics service Glassnode demonstrates how when bitcoin recovers back to the north of its Realized Price after a prolonged spell below it, this typically signifies the start of a new bull market.
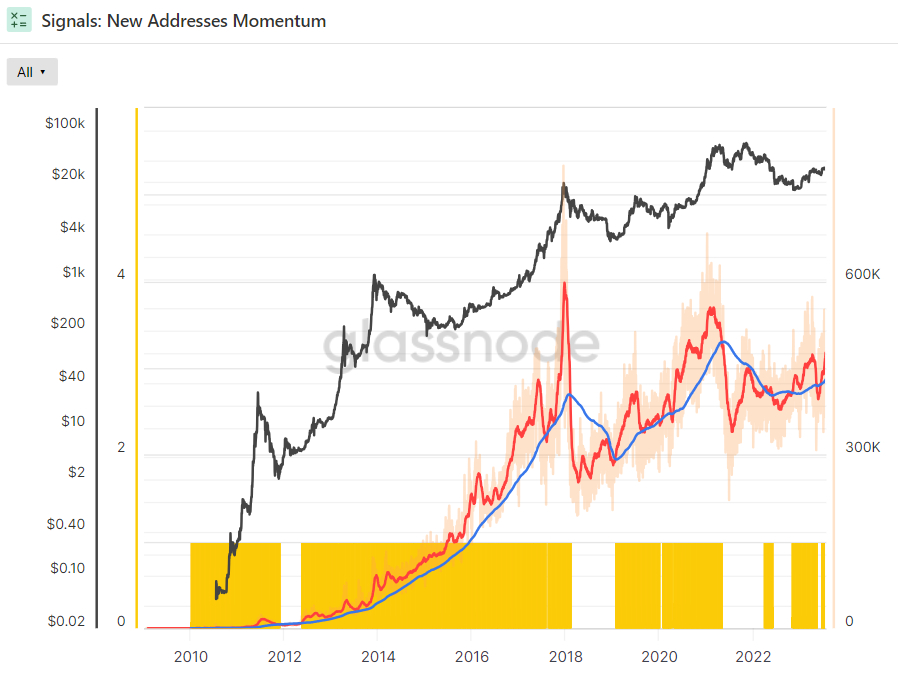
New Address Momentum Remains Positive
The 30-Day SMA of new Bitcoin address creation moved above its 365-Day SMA last November, signalling that the rate at which new Bitcoin wallets are being created is accelerating. This has historically occurred at or near the start of bull markets.
Revenue From Fees is Rising
Glassnode’s Revenue From Fees Multiple spiked higher a few weeks ago, sending its 2-year Z-score above 0, a sign that demand for blockspace is accelerating.
The Z-score is the number of standard deviations above or below the mean of a data sample.
In this instance, Glassnode’s Z-score is the number of standard deviations above or below the mean Bitcoin Fee Revenue of the last 2-years.
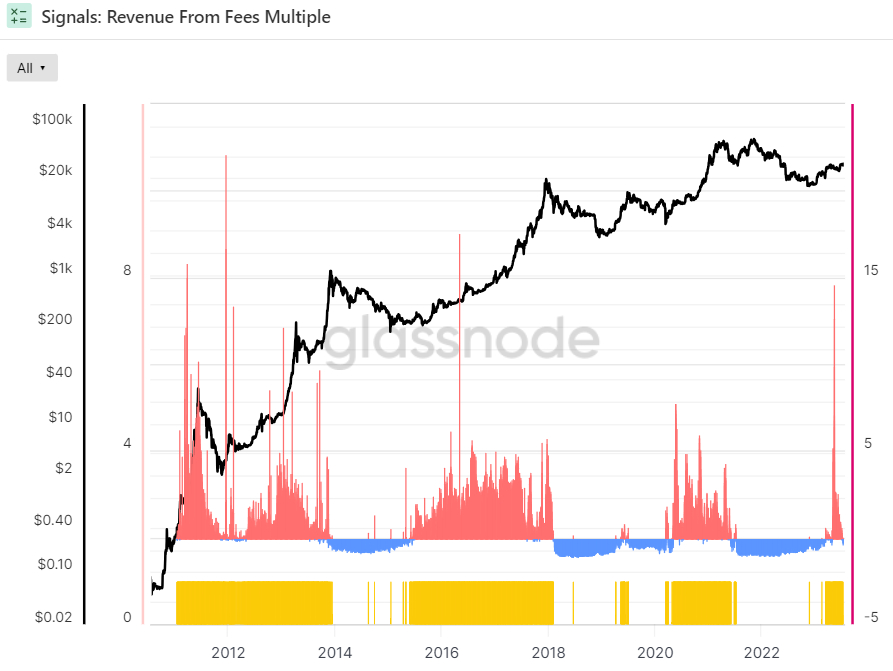
This shift above 0 in the Revenue From Fees Multiple’s 2-year Z-score typically occurs early in a bull market, signifying the beginnings of a period of on-chain expansion.
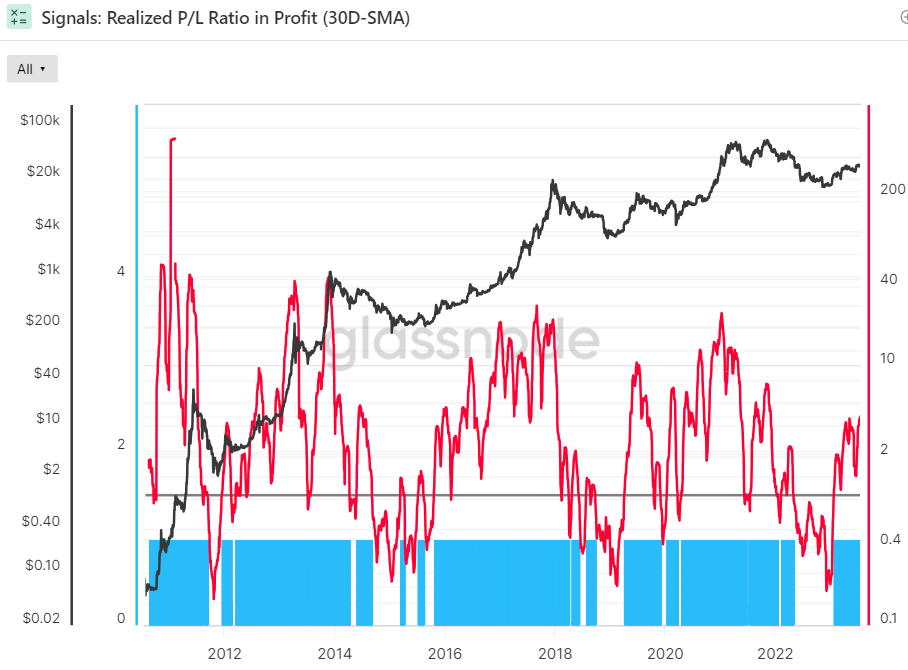
Market Profitability is Back
The 30-Day Simple Moving Average (SMA) of the Bitcoin Realized Profit-Loss Ratio (RPLR) indicator above one and rising.
That means that the Bitcoin market is realizing a greater proportion of profits (denominated in USD) than losses.
According to Glassnode, “this generally signifies that sellers with unrealized losses have been exhausted, and a healthier inflow of demand exists to absorb profit taking”.
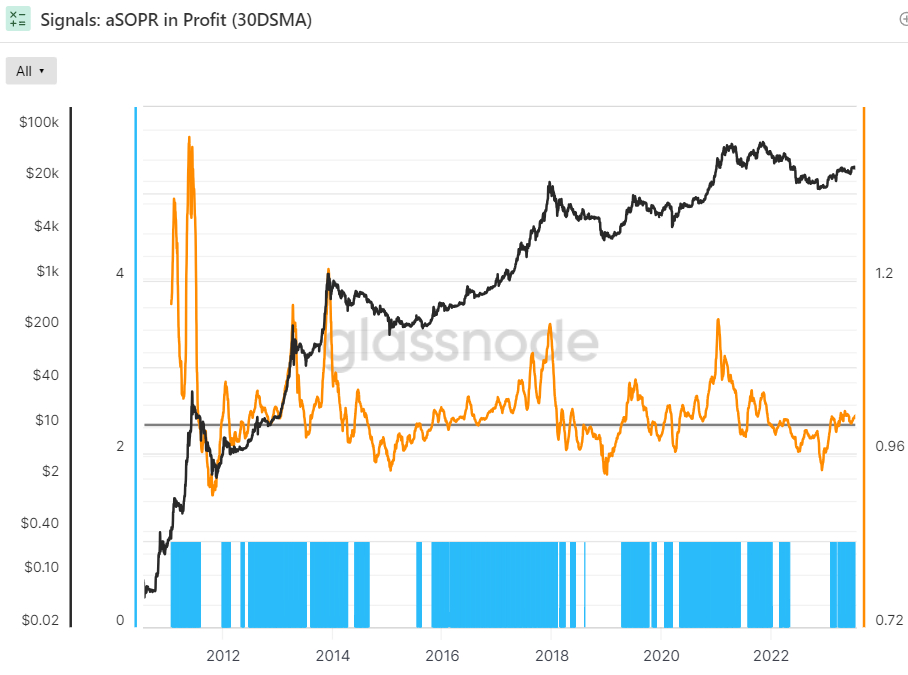
Meanwhile, the 30-day SMA of Bitcoin’s Adjusted Spent Output Profit Ration (aSOPR) indicator, an indicator that reflects the degree of realized profit and loss for all coins moved on-chain is also above one.
That essentially means that, on average over the past 30 days, the market is well in profit.
Looking back over the last eight years of Bitcoin history, the aSOPR rising above 1 after a prolonged spell below it has been a fantastic buy signal.
Elsewhere, the 90-day Exponential Moving Average (EMA) of Bitcoin Supply in Profit has been in an uptrend over the last 30 days as well.
Supply in Profit is the number of Bitcoins that last moved when USD-denominated prices were lower than they are right now, implying they were bought for a lower price and the wallet is holding onto a paper profit.
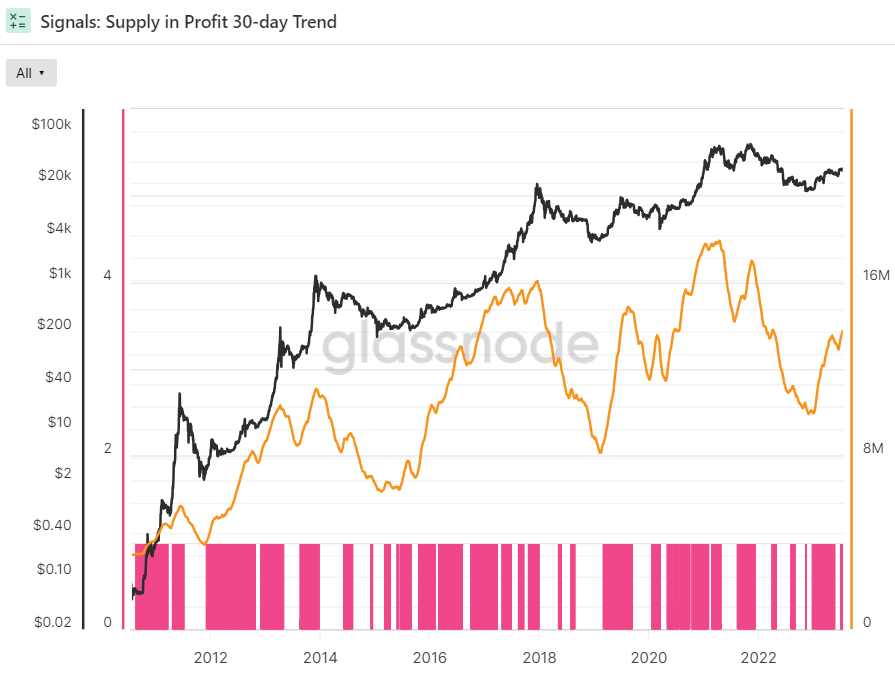
“Macro trend shifts in the volume of Supply in Profit can signal when a heavy concentration of investor cost basis has recently transitioned between unrealized profit, or loss,” Glassnode says, adding that “often these occur near macro market cycle changes”.
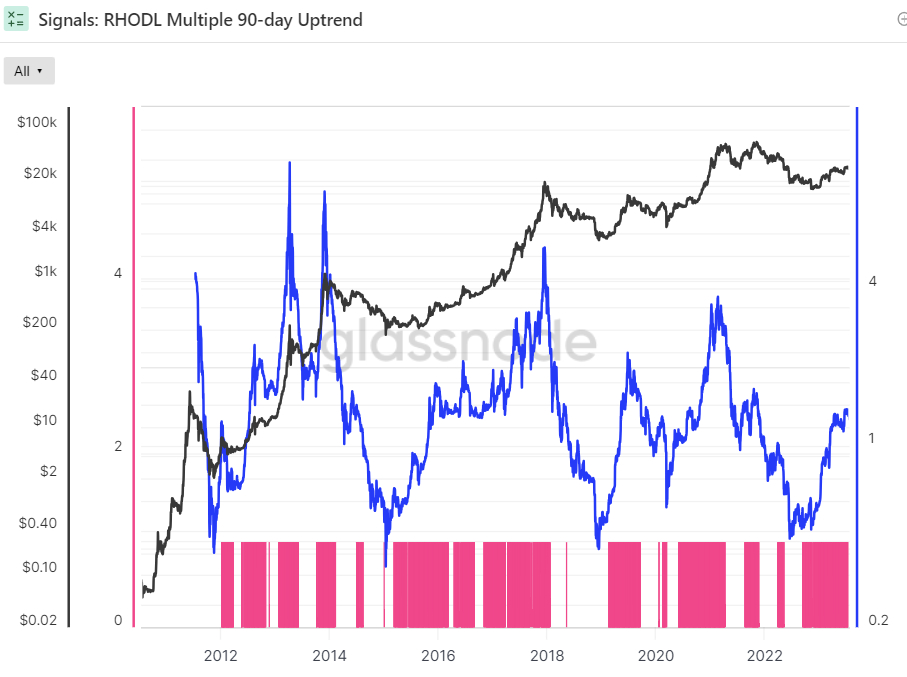
Bear Market Seller Exhaustion Reached
The following two indicators relate to whether the balance of USD wealth has sufficiently swung back in favor of the HODLers to signal weak-hand seller exhaustion.
After bottoming out at the end of last year, the Bitcoin Realized HODL Multiple has been in an uptrend for at least 90 days, a bullish sign according to Glassnode.
The crypto analytics firm states that “when the RHODL Multiple transitions into an uptrend over a 90-day window, it indicates that USD-denominated wealth is starting to shift back towards new demand inflows”.
HODLER Confidence Remains High Despite Still Low Prices
After hitting an all-time low in the aftermath of the FTX collapse last November, an indicator of bitcoin HODLer conviction called “Reserve Risk” has been gradually recovering, though remains at historically low levels.
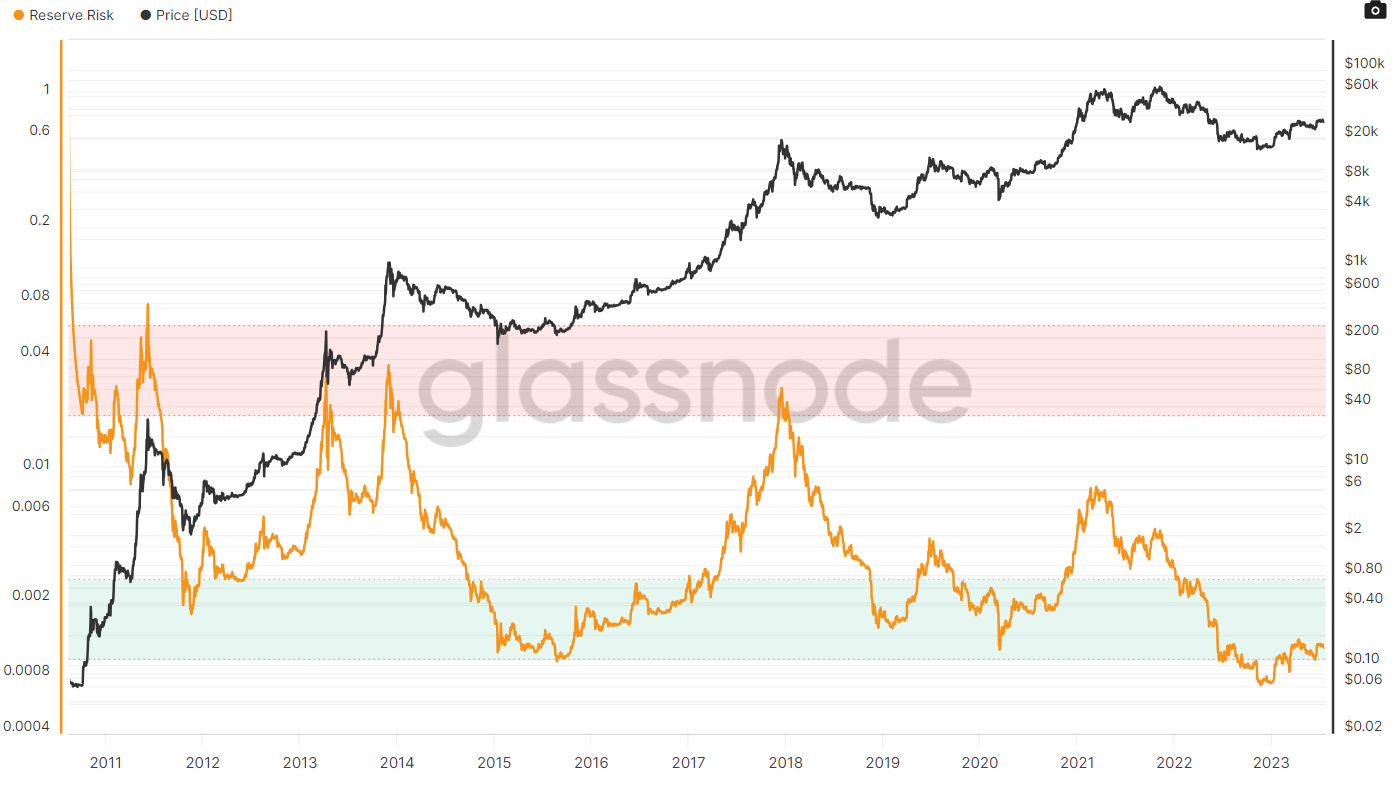
According to Glassnode, Reserve Risk is “used to assess the confidence of long-term holders relative to the price of the native coin at any given point in time”. Reserve Risk is “a long-term cyclical oscillator that models the ratio between the current price (incentive to sell) and the conviction of long-term investors (opportunity cost of not selling)”.
The conviction of long-term investors is encapsulated in Glassnode’s “HODL Bank” index, which represents an accumulation of unspent “opportunity cost” accrued by HODLers the longer they refuse to sell. Reserve Risk is thus defined as the current Bitcoin market price divided by the HODL Bank index score.
Glassnode says that when confidence is high and the BTC price is low (meaning a low Reserve Risk score), the risk/reward of investing in Bitcoin is attractive.
Hence, this indicator is arguably sending a strong buy signal.
- Microsoft Copilot AI Predicts Insane XRP Price by End Of 2026
- Perplexity AI Predicts XRP Will Hit This XRP Price by End of 2026
- Sam Altman ChatGPT AI Predicts Insane SpaceX Stock Price by End of 2026
- Google Gemini AI Predicts Shocking Bitcoin Price by End of 2026
- Premium Claude AI Model Fable 5 Predicts Bold Bitcoin Price Target by End of 2026
2M+
250+
8
70


- Microsoft Copilot AI Predicts Insane XRP Price by End Of 2026
- Perplexity AI Predicts XRP Will Hit This XRP Price by End of 2026
- Sam Altman ChatGPT AI Predicts Insane SpaceX Stock Price by End of 2026
- Google Gemini AI Predicts Shocking Bitcoin Price by End of 2026
- Premium Claude AI Model Fable 5 Predicts Bold Bitcoin Price Target by End of 2026
More Articles

