Bitcoin and Altcoins Calm Ahead of Next Move

Bitcoin has seen a decent recovery since the heavy sell-off two weeks ago. For Ether, the previous consolidation area between USD 275 and USD 290 acts as the closest resistance level.
Since our market update last week, bitcoin has continued to trade higher and is currently sitting at the psychologically important USD 6,500 level. Other coins have largely followed bitcoin higher, and we have seen stable prices and low volatility across the board in the cryptocurrency market.
Total market capitalization:

Bitcoin
The number one cryptocurrency by market cap has seen a decent recovery since the heavy sell-off two weeks ago, when the price plunged from USD 7,400 to USD 6,100 in just four days. In addition, bitcoin has managed to remain well above the lows in the USD 5,800 area from June, a sign that the market has stabilized overall and that the bears may finally have run out of steam.
For bitcoin, the USD 6,600 level marks the immediate resistance to the upside. If that level breaks, the previous market top at around USD 7,400 would become the next major resistance area.
Also, interesting to note about the bitcoin market is that the ratio between short and long trades is still at an unusually high level, according to data from the Bitfinex exchange. As we have seen in the past, a high short-to-long ratio may trigger sharp price increases.
Ethereum
Similar to bitcoin, the price of ether has also traded up over the past week, since reaching a bottom of USD 167 on Coinbase on September 12. Following that, the price bounced back, gaining over 15% on September 13 alone.
As demonstrated by the sharp rise on that day, the USD 180 level appears to be an area with significant buying interest, thus creating a floor in the market for Ethereum (at least for now). To the upside, the previous consolidation area between USD 275 and USD 290 acts as the closest resistance level.
Ripple
The price of the XRP token has formed what could be an interesting double bottom formation on the daily chart, which is normally a bullish sign. Since reaching the second bottom on September 11, XRP has traded slightly up followed by a sideways consolidation. For the market to indicate a reversal to a bullish trend, a short-term break above the USD 0.37 resistance would be needed.
Litecoin
The litecoin market has been stuck in a prolonged downtrend with only very small corrective rallies since May this year. Although the selling has become less intense in recent months, the market has continued to make new lows – the very definition of a downward trend used in technical analysis.
Judging from the charts, Litecoin should break above the previous high around the USD 68 area, followed by a low that is above the previous market low at around USD 50 – USD 55 until we can say that a reversal has happened. Until that happens, the technical outlook on litecoin remains bearish.
_____
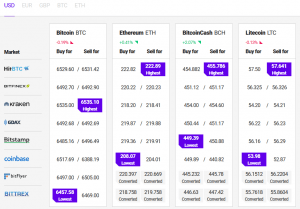
Find the best price to buy/sell some of the top cryptocurrencies: