Dogecoin Price Prediction as DOGE Falls 4.8% in 24 Hours – Time to Buy the Dip?


The price of Dogecoin seems to have temporarily slowed down from its recent upward trend, reaching a peak of around $0.0940. Currently, it is down 4.8% and trading at $0.0840. This decline is not limited to DOGE, as other cryptocurrencies such as Ethereum, Cardano, Solana, and Shiba Inu have also seen similar drops in their prices.
The total crypto market cap fell by approximately 3.5% to hold barely above $1 trillion. This is the first major pullback since bulls started to aggressively push for higher prices in early January. The uphill movements in Dogecoin and Shiba Inu brought back the meme coin hype, which contributed to the crypto market regaining the $1 trillion capitalization mark a couple of weeks ago.
A note about the state of the market by Bitfinex exchange – sent to CoinDesk outlines that the rally seems “promising on paper” but assets still lack the support of traders.
“While the rally looks promising on paper, the reality is that there are still limited traders in the markets,” analysts at Bitfinex wrote in a Jan.19 note sent to CoinDesk.”
Bitfinex explained that:
“With the recent leg-up driven purely by sentiment, low funding rates and cascading short liquidations.”
Dogecoin Price Rally Takes a Breather, Here’s Why It’s Set to Continue
Dogecoin price paused its three-week rally, but price analysis shows that the uptrend will soon resume. A forming green candle on the daily time chart sits on support at $0.0802 in confluence with the 50-day Exponential Moving Average (EMA) (in red) and the 100-day EMA (in blue).
However, bulls must hold their feet down and deal with an immediate resistance at $0.0866, as reinforced by the 200-day EMA (in purple) and the lower boundary of the falling trend channel. A successful break and hold above this seller congestion zone will leave bulls with only the upper boundary of the channel to worry about as they push for gains above $0.10.
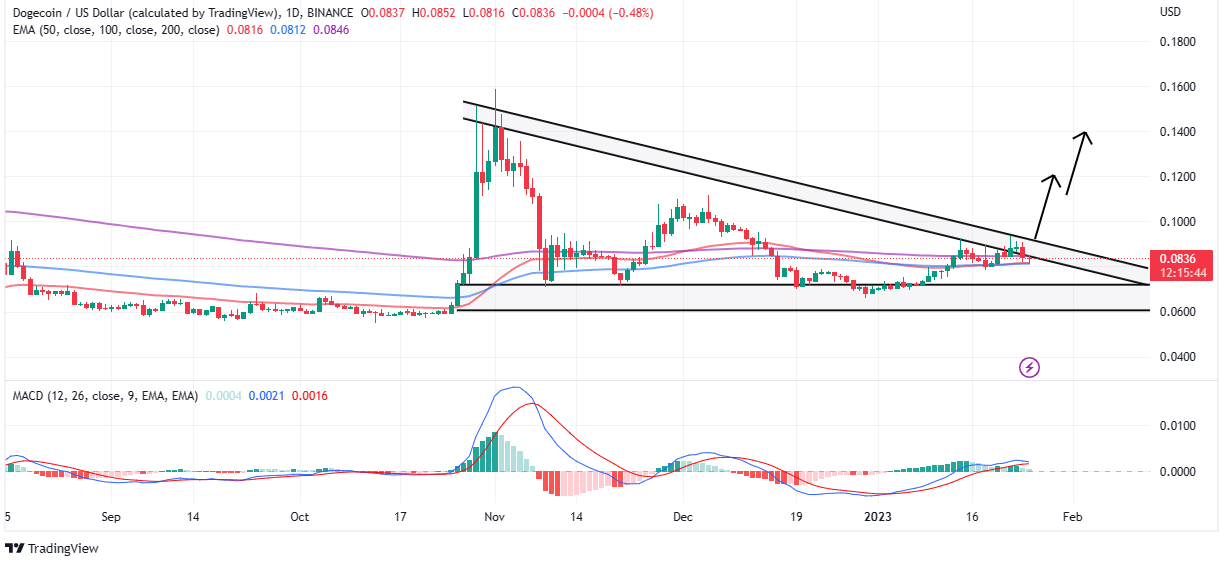
Although the Moving Average Convergence Divergence (MACD) indicator upholds the buy signal from the beginning of the year, there is a growing probability it will flip into a sell. Therefore, traders must watch for the MACD’s (line in blue) movement in the upcoming sessions because losses may intensify if it crosses beneath the mean line. Furthermore, closing in on the mean line and possibly the negative region would trigger a sell-off likely to force Dogecoin price down to $0.0722 and $0.0602, respectively.
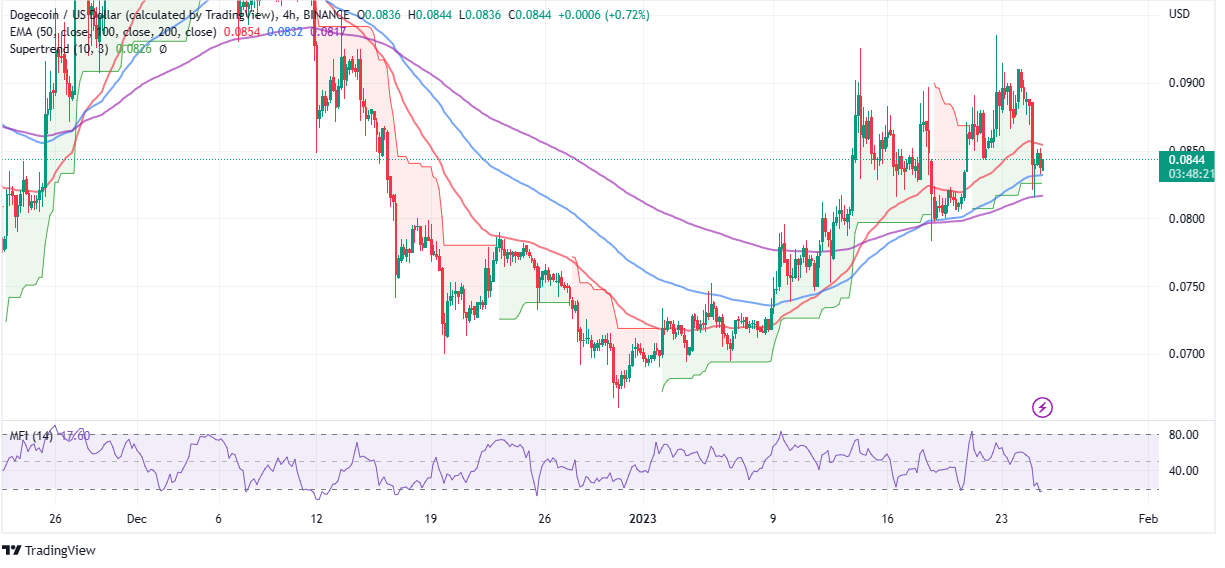
Dogecoin’s price outlook in shorter time frames is relatively weak– worsened by a negative volume flow observed with the Money Flow Index (MFI) indicator. Like the Relative Strength Index (RSI), the MFI measures momentum taking into account the inflow and outflow of funds in DOGE markets.
The sharp fall of the MFI from the overbought region into the oversold area suggests that sellers have the upper hand. Investors started betting on short positions in Dogecoin price immediately after sliding below $0.09, with more joining the selling party below the 50-day EMA at $0.0855.
If the downtrend persists more short positions would be taken below the 100-day EMA for a likely profit booking at the 200-day EMA (in purple) and $0.08.
Is It Plausible to Buy the Dogecoin Price Dip Now?
Despite this mid-week retracement, Dogecoin price may soon restart the uptrend. Key pointers for such a bullish scenario may be attributed to a buy signal from the Super Trend indicator. While overlaying the chart like a moving average, this technical index considers data from the average true range (ATR), thus gauging market volatility.
As long as the Super Trend indicator is trailing the Dogecoin price, the odds will favor a bullish outcome. Moreover, we cannot rule out the possibility of DOGE price regaining momentum from the 100-day EMA (in blue) on the four-hour time frame chart.
Therefore, traders wishing to enter new buy orders could consider waiting until Dogecoin price lifts above the 50-day EMA on the same daily chart. From here, buyers will be looking forward to a breakthrough above $0.09 and $0.10, respectively.
The strong support enjoyed by the Dogecoin price may be attributed to the many investors realizing profits after the breakout in January. The IOMAP model from IntoTheBlock establishes immense buyer congestion between $0.0738 and $0.076, where 51k addresses purchased roughly 40 billion DOGE. Investors in this range would be willing to throw their weight behind the Dogecoin price to back the resumption of the rally.
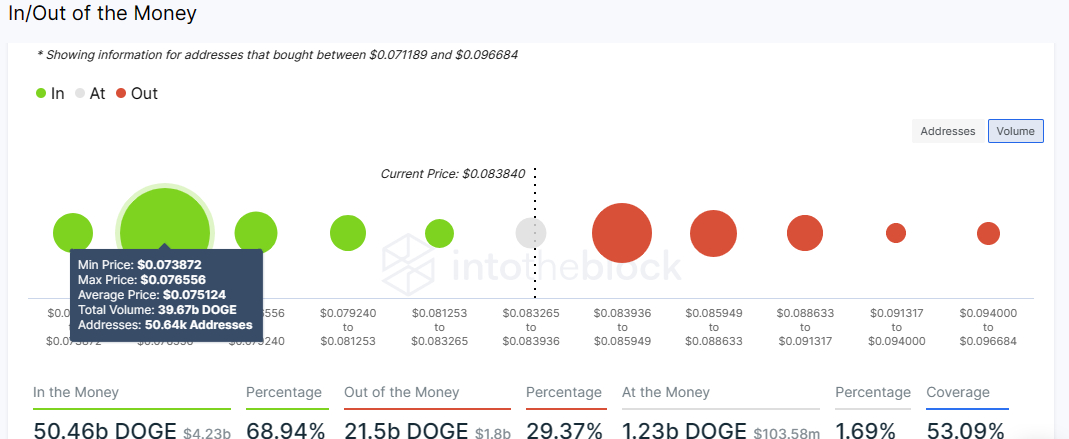
The model shines a light on the absence of strong strong resistance that might suppress a bullish outcome. Hence, the Dogecoin price requires a minor push to ignite an aggressive rally to highs beyond $0.10.
Buy DOGE Now
Dogecoin alternatives
If you’re looking for other high-potential crypto projects alongside DOGE, we’ve reviewed the top 15 cryptocurrencies for 2023, as analyzed by the CryptoNews Industry Talk team.
The list is updated weekly with new altcoins and ICO projects.
Disclaimer: The Industry Talk section features insights by crypto industry players and is not a part of the editorial content of Cryptonews.com.
Related Articles:
- Binance Crypto Exchange Admits to Mixing Customer Funds with Collateral for Binance-Issued Tokens
- Get In on the Ground Floor of This New Crypto Gaming Project, Just 4% Of Tokens Left in Presale
- Terra Luna Classic Price Prediction as LUNC Spikes Up 16% in 30 Days, $1 LUNC Incoming?


